🚀 How to Use Excalidraw AI to Quickly Generate Professional Diagrams and Boost Work Efficiency!
📢 Introduction
In the modern digital work environment, whether you’re a software engineer, UI/UX designer, business analyst, or educator, everyone needs to create professional diagrams to visualize complex information. Diagrams not only improve communication efficiency but are also essential components of technical documentation, product design, and business presentations.
Pain points of traditional drawing tools:
- Need to manually drag and drop components
- Time-consuming line adjustment
- Steep learning curve
Revolutionary breakthrough of AI drawing: Through Excalidraw AI, this revolutionary artificial intelligence drawing tool, we only need to input simple text descriptions to automatically generate professional flowcharts, mind maps, technical architecture diagrams, business process diagrams, and system design diagrams. This process is shortened from hours to minutes, making it an essential tool for modern development teams to boost productivity!
Key content of this article:
- Introduction to Excalidraw AI’s core features
- Detailed operational steps
- Complete diagram generation process demonstration through MQTT communication protocol flowchart example
🎯 Why Choose Excalidraw AI?
What is Excalidraw? Excalidraw is a popular open-source hand-drawn style drawing tool, known for its clean interface and natural hand-drawn texture. In the software development community, it’s acclaimed as one of the most suitable visualization tools for programmers and product managers.
AI functionality enhancement: Excalidraw AI adds AI automatic drawing functionality to the original foundation, combining machine learning and natural language processing technologies. It can:
- Intelligently identify content structure and logical relationships in text descriptions
- Automatically determine appropriate diagram types (flowcharts, architecture diagrams, mind maps, etc.)
- Generate professional visualization diagrams that comply with software engineering and business logic
Simply put: You just need to describe the diagram you want in natural language, and AI will draw it for you!
✅ Four Core Advantages of Excalidraw AI
1. 🚀 Ultra-fast Diagram Generation
- No need to learn complex drawing operations
- Get complete diagrams within seconds after inputting text descriptions
- Dramatically save design time, allowing you to focus on content creation
2. 📊 Rich Diagram Type Support
- Technical: Flowcharts, system architecture diagrams, network topology diagrams
- Business: Organizational charts, business process diagrams, project timeline charts
- Learning: Mind maps, concept maps, knowledge structure diagrams
3. ✏️ Flexible Editing and Customization
- Manual fine-tuning available after AI generation
- Support for personalized color, shape, and text modifications
- Perfect combination of AI efficiency and manual precision
4. 🆓 Completely Free and Easy to Use
- Open-source project, no paid subscription required
- Direct browser use, no software installation needed
- Cross-platform support, create anywhere, anytime
🛠 How to Use Excalidraw AI to Generate Professional Diagrams?
Next, we’ll teach you step-by-step how to use Excalidraw AI to generate professional diagrams through practical operation examples. This example will use MQTT communication protocol flowchart to demonstrate the complete operational process.
1️⃣ Step 1: Enter Excalidraw AI Work Interface
Getting started is very simple:
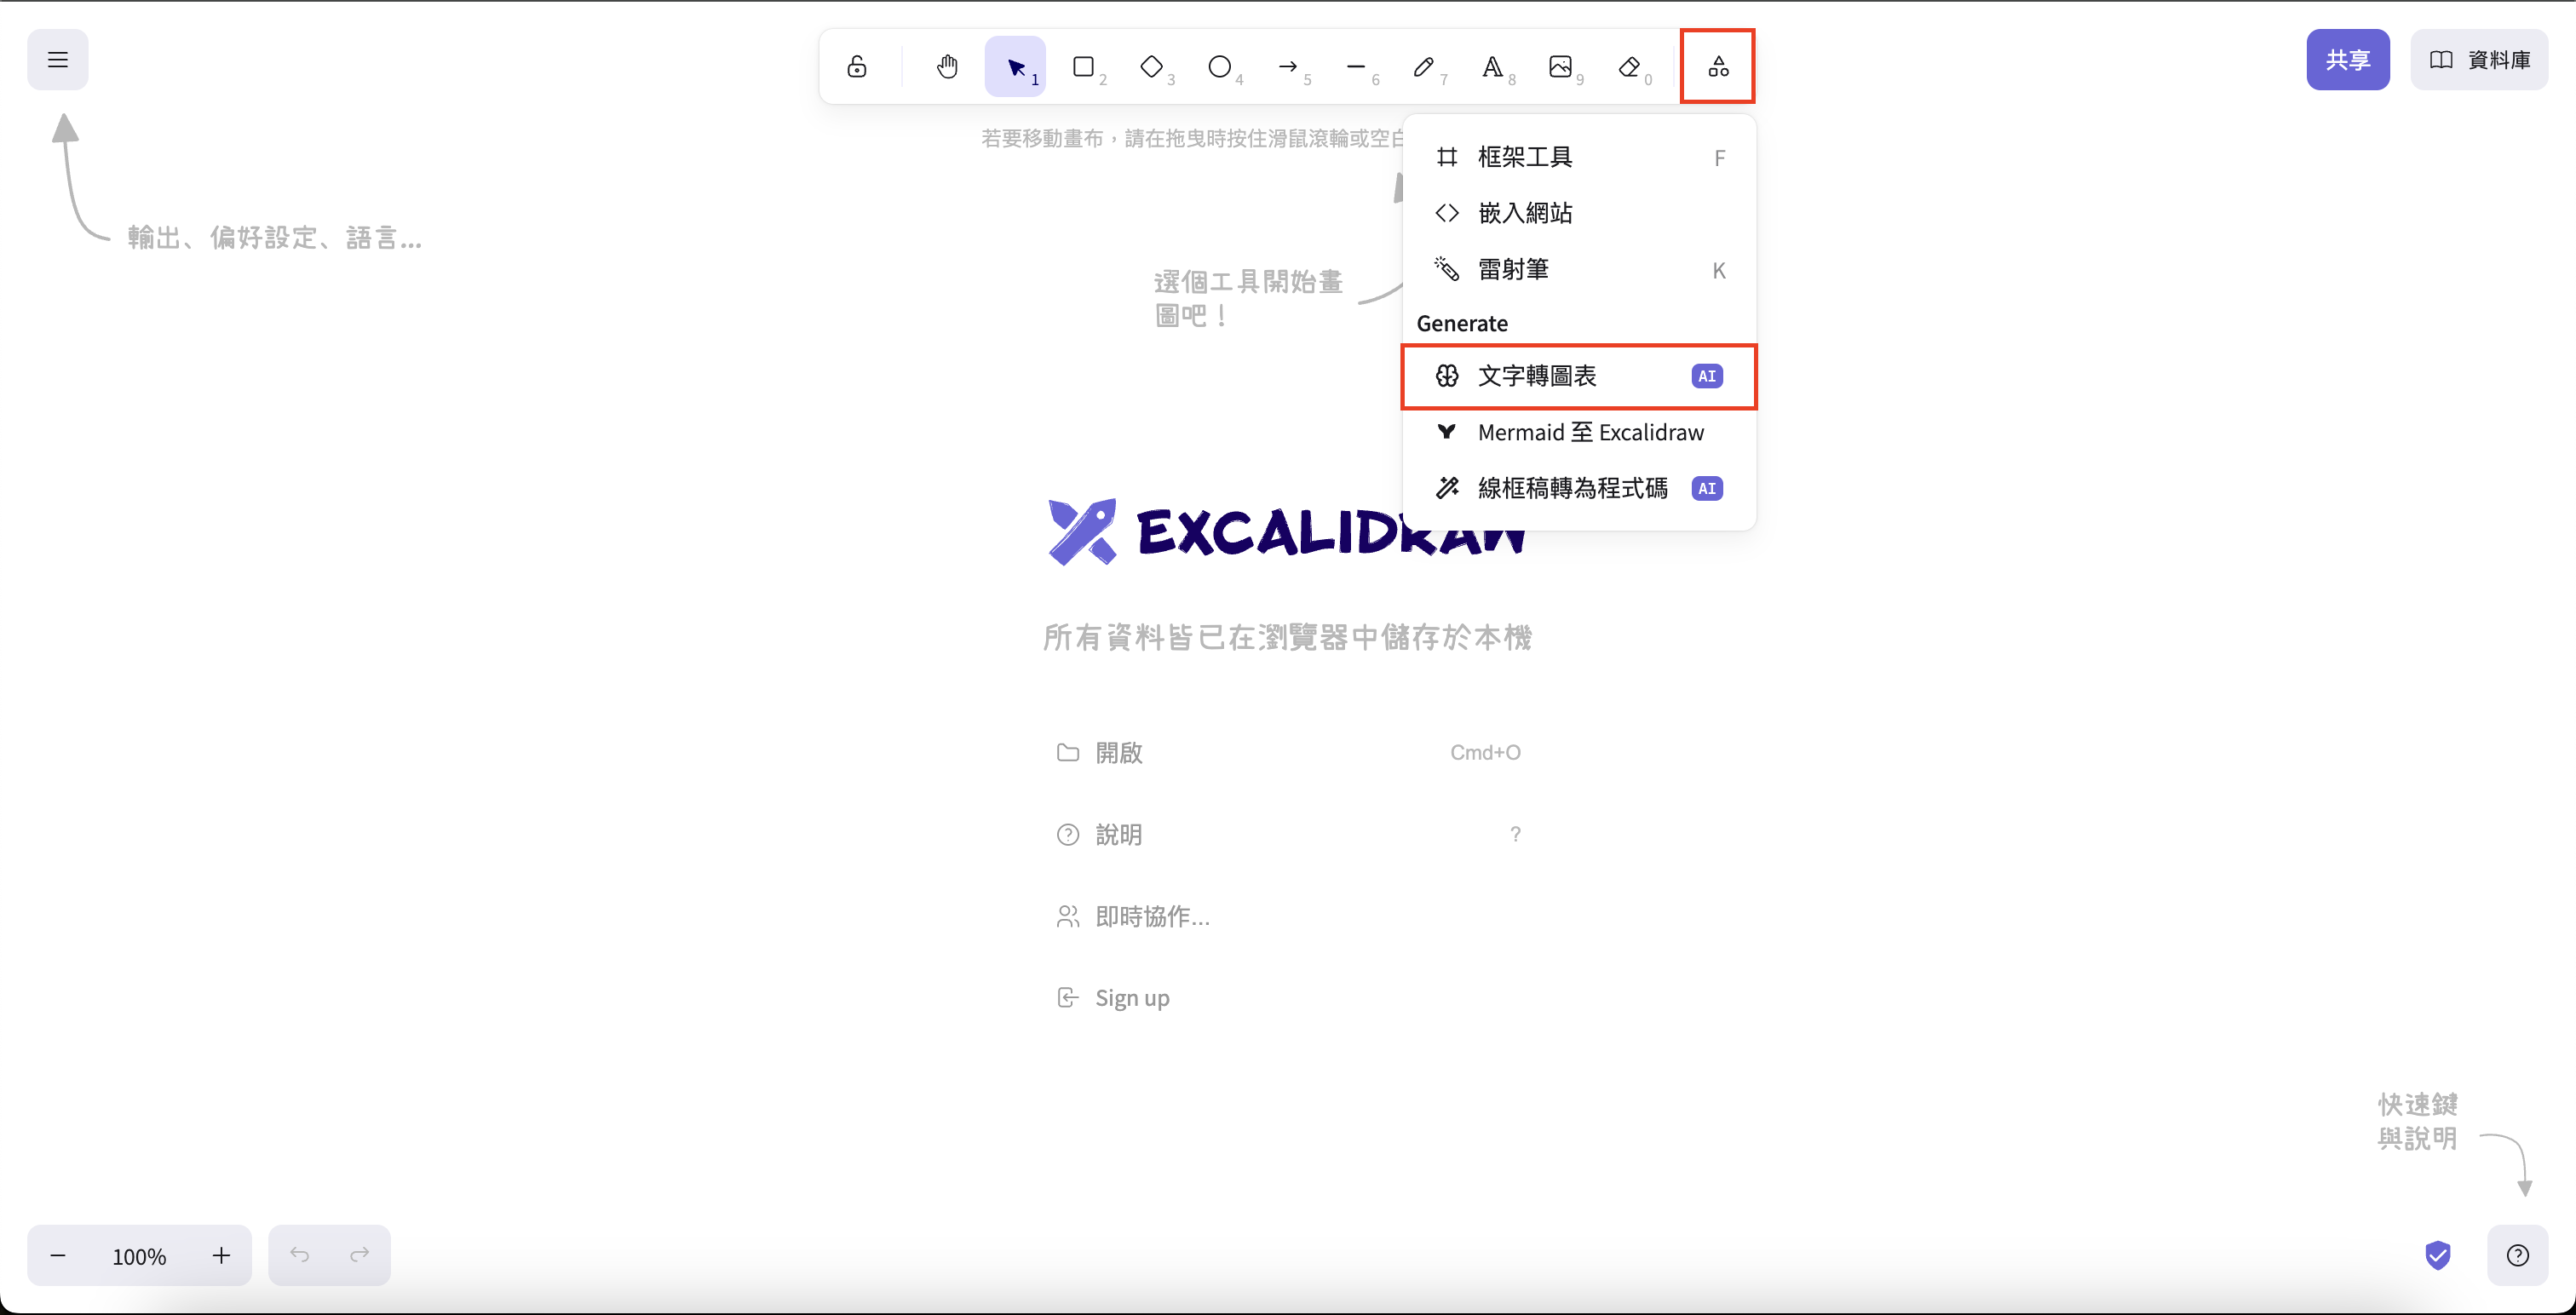
- Open your browser and go to Excalidraw AI Official Website
- Find the
More Toolsoption in the upper right corner - Click on
Text to Diagram AIfeature
Tip: No account registration required, start using immediately!

2️⃣ Step 2: Write Clear Text Descriptions
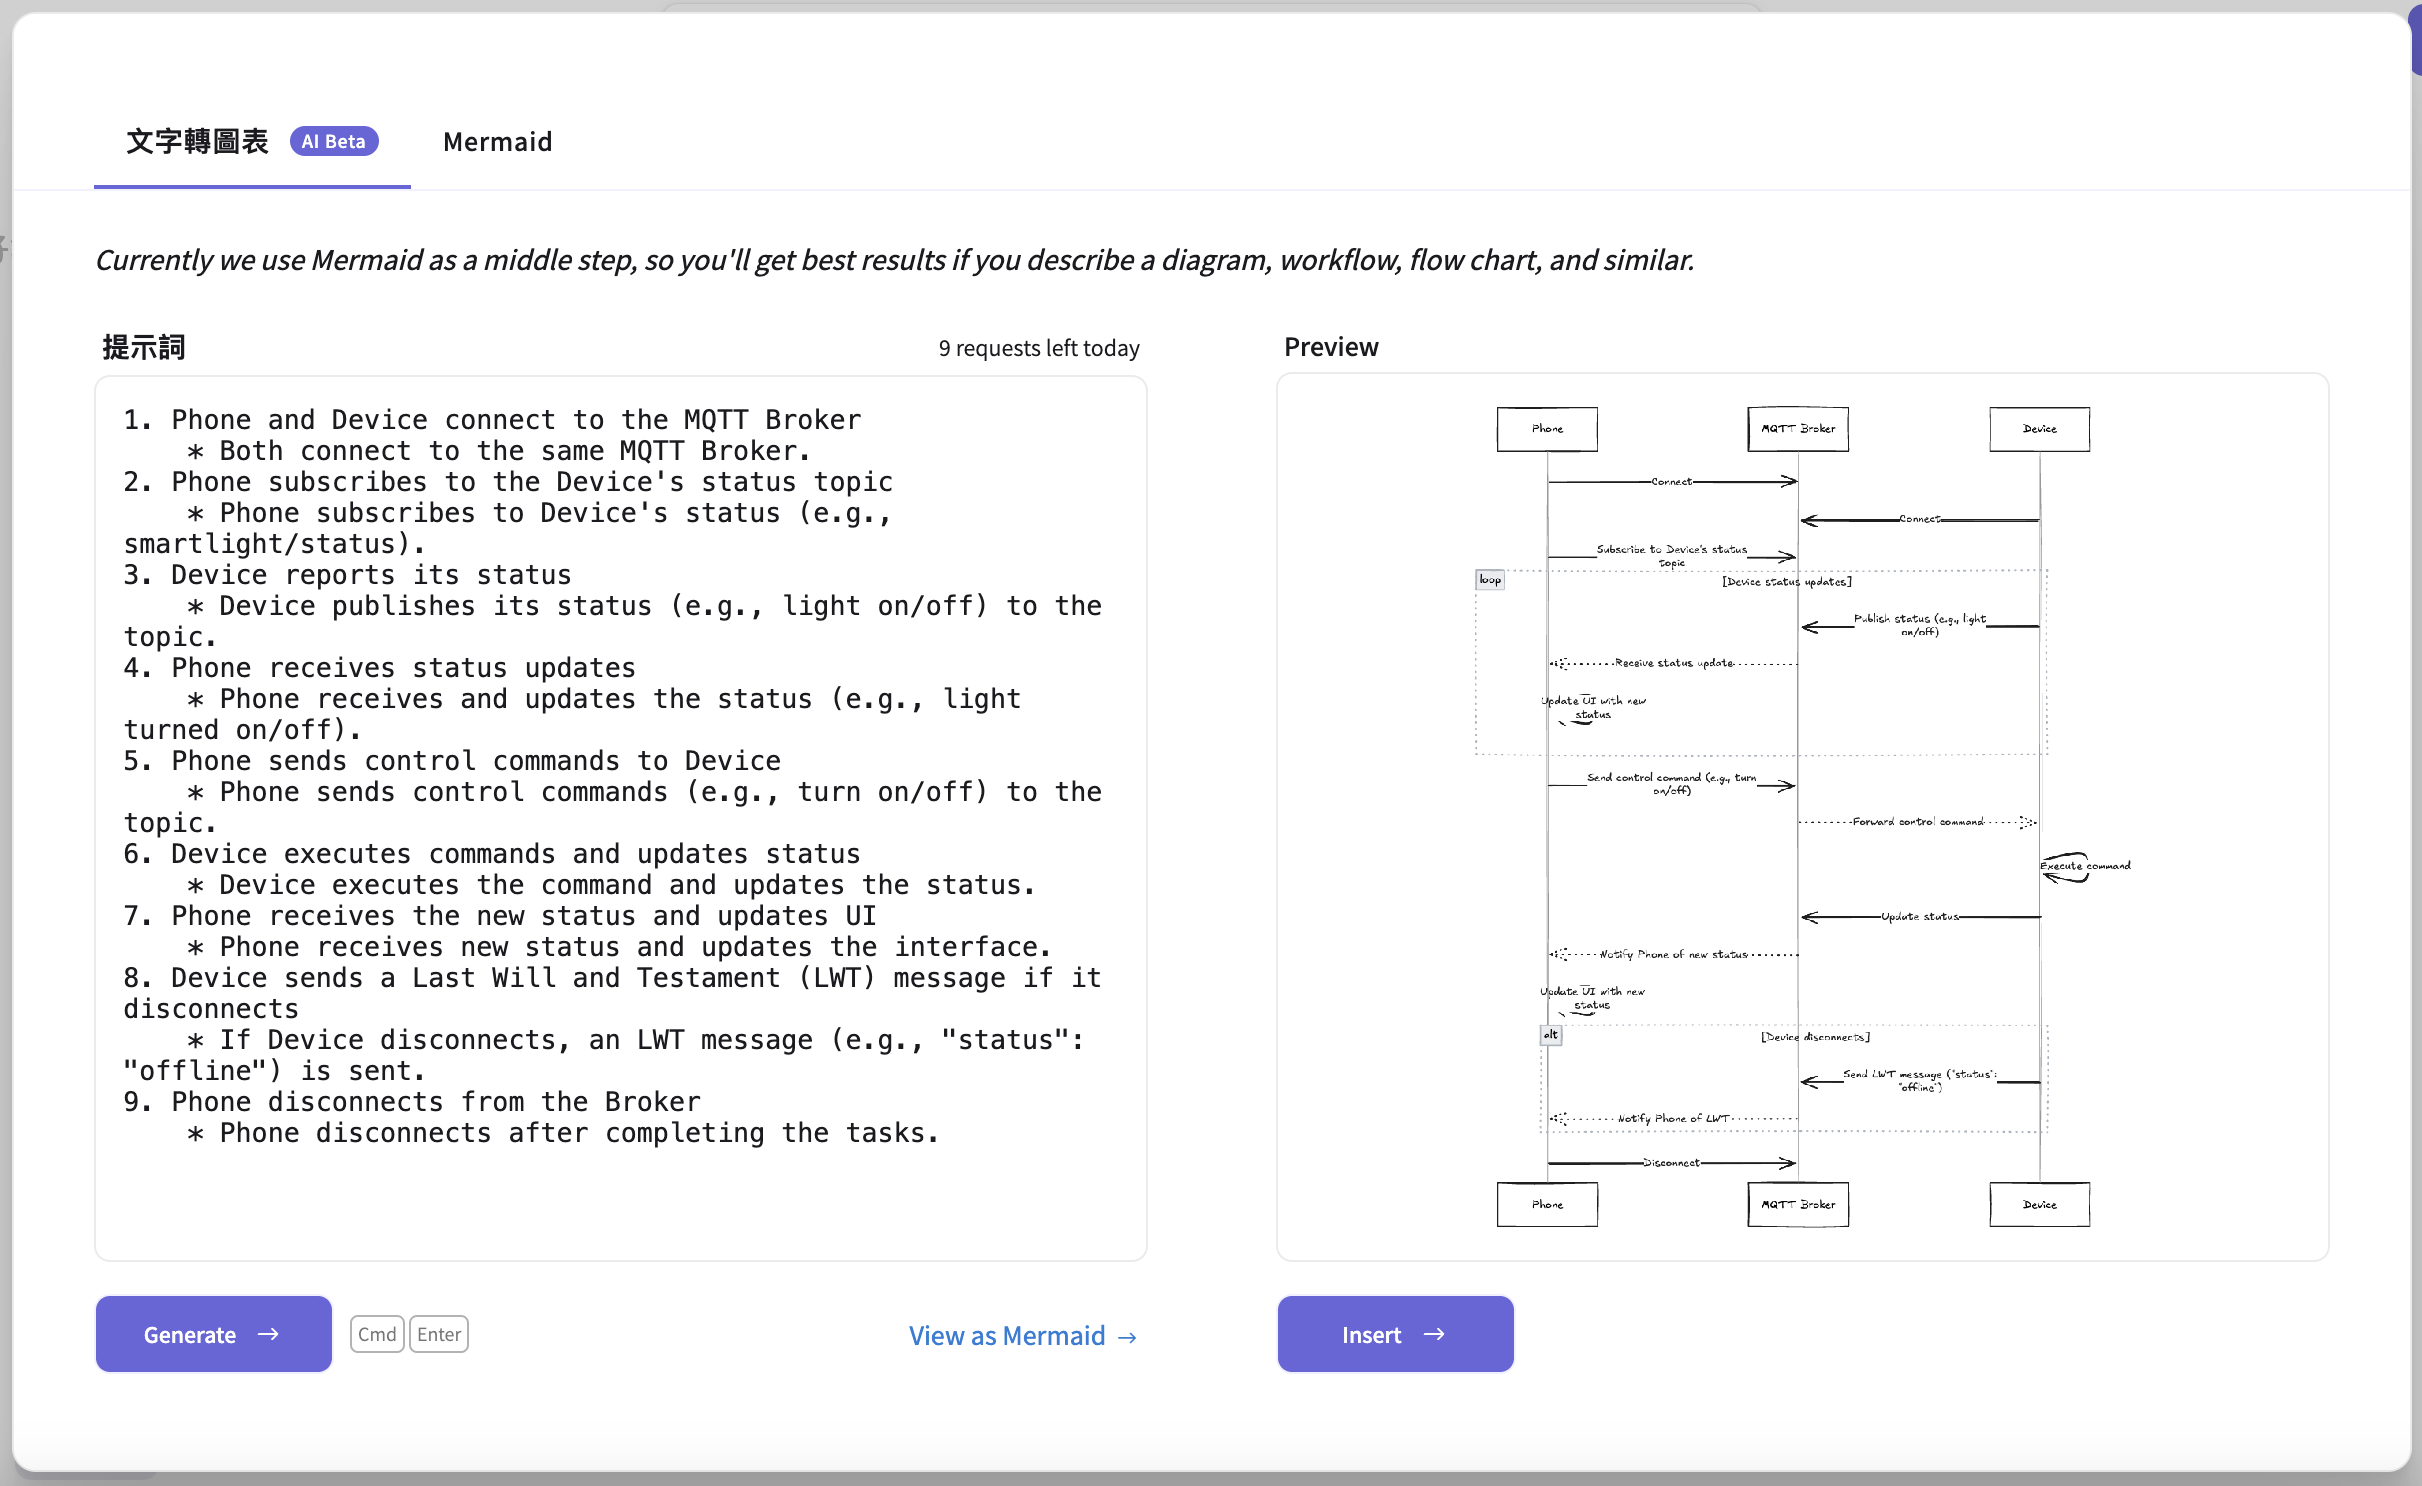
Now comes the crucial step! We need to tell the AI what kind of diagram we want with clear descriptions in the text input box.
Example goal: Generate an MQTT communication protocol flowchart
Description writing techniques:
- Use titles to clearly explain the diagram topic
- List process steps in numbered order
- Provide detailed explanations under each step
- Use specific technical terminology (such as MQTT Broker, LWT, etc.)
Complete input content as follows:
Title: Client-Client Communication via Server
1. Phone and Device connect to the MQTT Broker
    * Both connect to the same MQTT Broker.
2. Phone subscribes to the Device's status topic
    * Phone subscribes to Device's status (e.g., smartlight/status).
3. Device reports its status
    * Device publishes its status (e.g., light on/off) to the topic.
4. Phone receives status updates
    * Phone receives and updates the status (e.g., light turned on/off).
5. Phone sends control commands to Device
    * Phone sends control commands (e.g., turn on/off) to the topic.
6. Device executes commands and updates status
    * Device executes the command and updates the status.
7. Phone receives the new status and updates UI
    * Phone receives new status and updates the interface.
8. Device sends a Last Will and Testament (LWT) message if it disconnects
    * If Device disconnects, an LWT message (e.g., "status": "offline") is sent.
9. Phone disconnects from the Broker
    * Phone disconnects after completing the tasks.

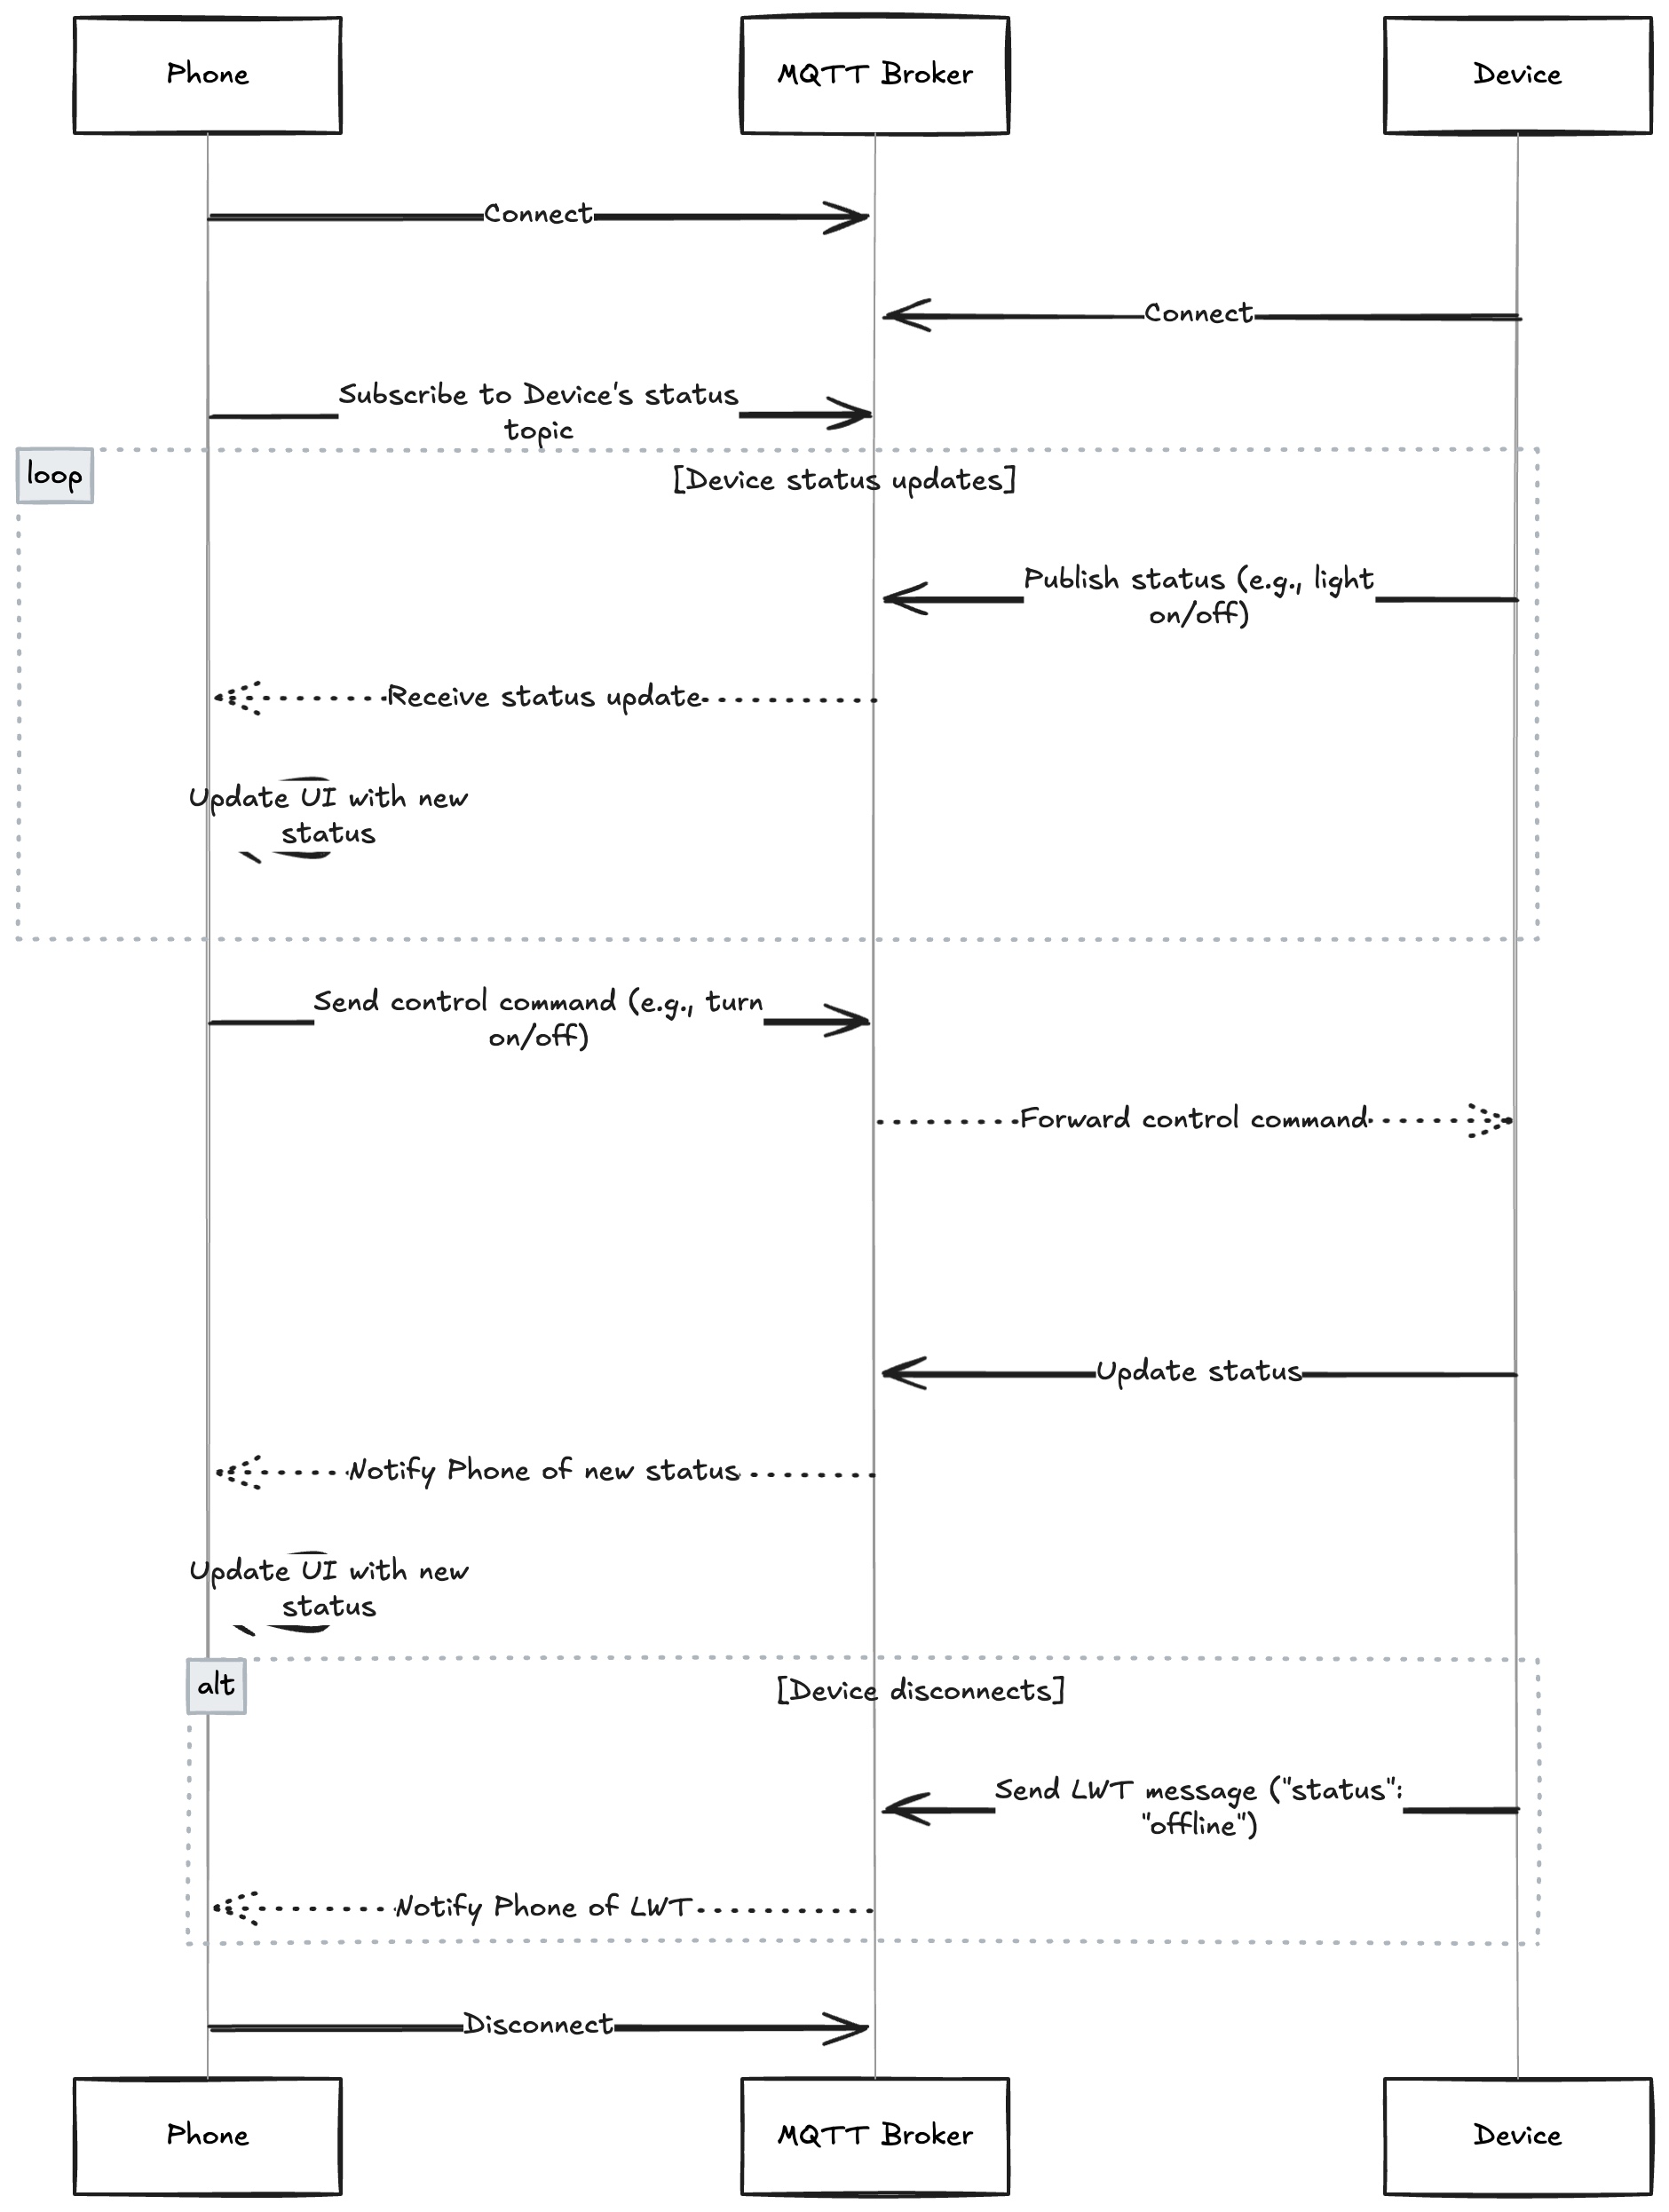
3️⃣ Step 3: AI Smart Generation and Subsequent Adjustments
AI processing workflow: When you submit the text description, Excalidraw AI will:
- Analyze content structure - Understand the logical relationships in the process
- Determine diagram type - Automatically select the most suitable visualization method
- Generate initial diagram - Create a complete diagram containing all elements
Adjustment options after generation:
- Node position adjustment - Drag and move diagram components
- Line optimization - Adjust connection line paths and styles
- Text editing - Modify labels and description text
- Color customization - Change component colors to highlight key points
Important reminder: The AI-generated diagram is a great starting point, and you can make fine adjustments according to actual needs!

🎯 Practical Applications of Excalidraw AI
Excalidraw AI has a very wide range of applications. Here are the specific use cases organized into four main areas:
👨💻 Engineering and Technical Fields
System Design and Architecture Visualization:
- API Interaction Diagrams - Show data exchange processes between RESTful API and GraphQL services
- Microservice Architecture Diagrams - Present relationships between containerized applications, databases, cache layers, and message queues
- Network Topology Diagrams - Visualize connections between Docker containers, Kubernetes clusters, and cloud services
- Database Design Diagrams - Show ER diagrams for relational databases and NoSQL data models
Development Process Management:
- CI/CD Pipeline Diagrams - Show the complete process from code development to deployment
- Data Flow Diagrams - Track data processing paths within systems
🎨 Design and Creative Fields
User Experience Design:
- User Journey Maps - Describe the complete user experience with product interactions
- Interface Flow Diagrams - Design page navigation logic for apps or websites
- Prototype Wireframes - Quickly conceptualize product interface layouts
Creative Brainstorming Tools:
- Brainstorming Diagrams - Organize ideas and concepts from creative meetings
- Design Thinking Processes - Visualize various stages of design projects
📊 Business and Strategy Fields
Operations Management Optimization:
- Business Process Diagrams - Streamline internal company workflows to find efficiency improvements
- Organizational Charts - Clearly show departmental relationships and reporting levels
- Customer Service Processes - Optimize standardized processes for customer issue handling
Strategic Planning Visualization:
- Project Timeline Charts - Show project milestones and dependencies
- Market Analysis Diagrams - Visualize competitor analysis and market positioning
📚 Education and Learning Fields
Knowledge Structure Organization:
- Concept Maps - Help students understand relationships between subject knowledge
- Learning Path Diagrams - Plan course learning sequences and key points
- Research Framework Diagrams - Organize theoretical frameworks for thesis research
Teaching Aid Tools:
- Teaching Flow Diagrams - Design sequences for classroom activities
- Knowledge Point Connection Diagrams - Show connections between different chapter contents
⚡ How AI Drawing Tools Revolutionarily Boost Your Work Efficiency?
Let’s look at the specific changes AI drawing tools bring from actual data and user experience:
Amazing Time Efficiency Improvements
Traditional Drawing vs AI Drawing Time Comparison:
- 🚀 Complex Flowchart Creation - Reduced from 2-3 hours to 5-10 minutes
- 📊 System Architecture Diagram Design - Reduced from 1-2 days to 30 minutes
- 🧠 Mind Map Creation - Reduced from 1 hour to 3-5 minutes
Comprehensive Work Quality Upgrades
Professional Enhancement:
- Technical Documentation Visualization - Make complex technical concepts clear at a glance
- Business Presentation Value-Add - Diagrams make proposals more persuasive
- Teaching Effectiveness Optimization - Abstract concepts become easier to understand through visualization
Collaboration Efficiency Improvements:
- Smoother Team Communication - Images convey ideas more accurately than text
- Easier Cross-Department Collaboration - Unified visual language reduces misunderstandings
Cost-Benefit Analysis
Economic Advantages:
- 🆓 Zero Cost Investment - Completely free open-source tool
- ⏰ Time is Money - Dramatically saved time can be invested in more valuable work
- 🎯 Low Learning Costs - No professional design skills required, anyone can master it
🔥 Summary: Start Your AI Drawing Journey
Core Value of Excalidraw AI
Excalidraw AI is not just a drawing tool, but a catalyst for work efficiency revolution. It transforms the creation of visualization diagrams from a professional skill into a basic ability that everyone can master.
Wide Range of Applicable Users
Technical Professionals:
- Engineers - Quickly convert technical architectures, communication protocols, and data flow designs into clear diagrams
- System Analysts - Visualize complex system requirements and process designs
Creative and Educational Workers:
- Designers - Create concept diagrams and flowcharts with hand-drawn texture
- Teachers and Instructors - Make mind maps and knowledge structure diagrams for teaching
Business Management Personnel:
- Project Managers - Visualize project timelines and workflows
- Business Analysts - Create business process diagrams and organizational charts
Immediate Action Recommendations
If you frequently need to in your work:
- Explain complex concepts or processes
- Create presentations and technical documentation
- Conduct team collaboration and communication
- Organize thoughts and plan projects
Then try Excalidraw AI now! Let AI technology help you say goodbye to tedious manual drawing and focus on truly important creativity and strategic thinking.
Remember: In the AI era, those who use tools wisely will stay ahead in competition!
🔗 Extended Reading
Enjoy Reading This Article?
Here are some more articles you might like to read next: