Complete Android Network Packet Analysis Tutorial: Using tcpdump and Wireshark for Debugging
Introduction
I recently encountered a work issue that could only be clarified through packet capture analysis. This situation is quite common when developing network applications or debugging connectivity problems.
In the past when developing for iOS, using rvictl -s [UUID] could create a virtual network interface, making packet capture through Wireshark super simple. But Android’s network packet capture isn’t quite as intuitive.
After some research, I successfully found a reliable solution. This tutorial will completely document the entire process, hoping to help developers facing the same challenges.
Prerequisites
Before getting started, please confirm you have prepared the following tools and environment:
- A rooted Android device - this is the most critical requirement
- tcpdump executable file - used to capture packets on Android devices
- Wireshark - used to analyze captured packet data
Why do we need root permissions? Because network packet capture requires system-level permissions to access low-level network interfaces.
WARNING
If you don’t have root permissions, you can use tPacketCapture, but it intercepts packets through VPN method. In my testing, this has packet dropping issues, so I don’t recommend relying on it.
Transfer tcpdump to Android Device
First, we need to transfer the tcpdump executable file to the Android device. Use ADB commands to push the file to the /data/local/ directory:
adb push tcpdump /data/local/tcpdump
Common Issue Resolution: If you encounter a can't execute: Permission denied error, this indicates higher permissions are needed. In this case, you can first gain root permissions before uploading:
adb root
adb push tcpdump /data/local/tcpdump
adb unroot
This step temporarily elevates ADB permissions, completes the file transfer, then reverts to normal permissions.
Execute tcpdump for Packet Capture
Now that tcpdump is on the device, we need to set execution permissions and begin capturing packets.
Step 1: Enter device and gain permissions
adb shell
su
cd /data/local
These three commands will sequentially: connect to Android shell, switch to root user, and move to the tcpdump directory.
Step 2: Set execution permissions
chmod a+x tcpdump
This command makes the tcpdump file executable. If you skip this step, the system will refuse to execute tcpdump.
Step 3: Begin packet capture
./tcpdump -i any -p -s 0 -w /sdcard/capture.pcap
Parameter explanations:
-
-i any: Monitor all network interfaces -
-p: Don’t put network card in promiscuous mode -
-s 0: Capture complete packets (no truncation) -
-w: Write results to file
After execution, tcpdump will begin capturing all network traffic in real-time. Use Control + C to end capture, and the packet data will be saved in the capture.pcap file on the SD card.
Export Packet File to Computer
After packet capture is complete, you need to transfer the .pcap file from the Android device to your computer for analysis.
adb pull /sdcard/capture.pcap
This command will download the packet file to your current working directory. If you want to specify a download location, you can add the target path after the command.
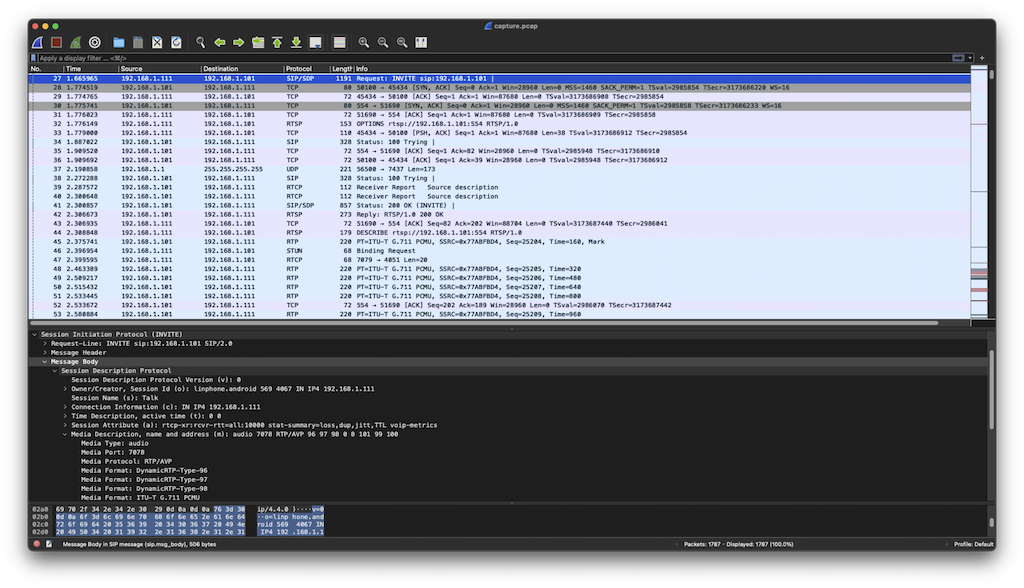
Begin packet analysis: After file transfer is complete, use Wireshark to open the .pcap file to begin detailed analysis:

Summary
Packet analysis is one of the most valuable tools in debugging techniques. Regardless of what network-related problems you encounter, packets can provide the most direct evidence.
Common application scenarios include:
- Backend API integration anomalies
- Unstable network connections or disconnections
- Third-party library non-responsiveness
- Streaming media playback issues
Real-world case sharing:
I once encountered a tricky problem: an iOS application using FFMpeg to connect to RTSP streams would always automatically disconnect after 1 minute. Log files showed no clues at all, which was quite frustrating.
Later, through Wireshark packet traffic analysis, I discovered that FFMpeg wasn’t regularly sending GET_PARAMETER keepalive packets to the RTSP server. After finding the root cause, I modified the source code to add a keepalive mechanism, and the problem was immediately resolved!
TIP
When logs show nothing and the console remains silent, packets will always tell the truth. Being able to capture packets can save you several times the debugging time.
Reference Resources
Enjoy Reading This Article?
Here are some more articles you might like to read next: